Explainable Boosting Machine#
Links to API References: ExplainableBoostingClassifier, ExplainableBoostingRegressor
See the reference paper for full details [1]. Link
Summary
Explainable Boosting Machine (EBM) is a tree-based, cyclic gradient boosting Generalized Additive Model with automatic interaction detection. EBMs are often as accurate as state-of-the-art blackbox models while remaining completely interpretable.
How it Works
As part of the framework, InterpretML also includes a new interpretability algorithm – the Explainable Boosting Machine (EBM). EBM is a glassbox model, designed to have accuracy comparable to state-of-the-art machine learning methods like Random Forest and Boosted Trees, while being highly intelligibile and explainable. EBM is a generalized additive model (GAM) of the form:
where \(g\) is the link function that adapts the GAM to different settings such as regression or classification.
EBM has a few major improvements over traditional GAMs [2]. First, EBM learns each feature function \(f_j\) using modern machine learning techniques such as bagging and gradient boosting. The boosting procedure is carefully restricted to train on one feature at a time in round-robin fashion using a very low learning rate so that feature order does not matter. It round-robin cycles through features to mitigate the effects of co-linearity and to learn the best feature function \(f_j\) for each feature to show how each feature contributes to the model’s prediction for the problem. Second, EBM can automatically detect and include pairwise interaction terms of the form:
which further increases accuracy while maintaining intelligibility. EBM is a fast implementation of the GA2M algorithm [1], written in C++ and Python. The implementation is parallelizable, and takes advantage of joblib to provide multi-core and multi-machine parallelization. The algorithmic details for the training procedure, selection of pairwise interaction terms, and case studies can be found in [1, 3, 4].
EBMs are highly intelligible because the contribution of each feature to a final prediction can be visualized and understood by plotting \(f_j\). Because EBM is an additive model, each feature contributes to predictions in a modular way that makes it easy to reason about the contribution of each feature to the prediction.
To make individual predictions, each function \(f_j\) acts as a lookup table per feature, and returns a term contribution. These term contributions are simply added up, and passed through the link function \(g\) to compute the final prediction. Because of the modularity (additivity), term contributions can be sorted and visualized to show which features had the most impact on any individual prediction.
To keep the individual terms additive, EBM pays an additional training cost, making it somewhat slower than similar methods. However, because making predictions involves simple additions and lookups inside of the feature functions \(f_j\), EBMs are one of the fastest models to execute at prediction time. EBM’s light memory usage and fast predict times makes it particularly attractive for model deployment in production.
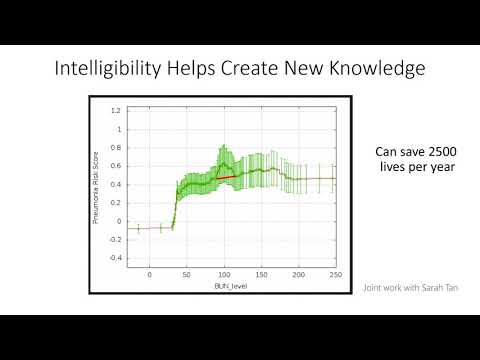
If you find video as a better medium for learning the algorithm, you can find a conceptual overview of the algorithm below:
Code Example
The following code will train an EBM classifier for the adult income dataset. The visualizations provided will be for both global and local explanations.
import numpy as np
import pandas as pd
from sklearn.model_selection import train_test_split
from sklearn.metrics import roc_auc_score

from interpret.glassbox import ExplainableBoostingClassifier
from interpret import show

df = pd.read_csv(
    "https://archive.ics.uci.edu/ml/machine-learning-databases/adult/adult.data",
    header=None)
df.columns = [
    "Age", "WorkClass", "fnlwgt", "Education", "EducationNum",
    "MaritalStatus", "Occupation", "Relationship", "Race", "Gender",
    "CapitalGain", "CapitalLoss", "HoursPerWeek", "NativeCountry", "Income"
]
X = df.iloc[:, :-1]
y = df.iloc[:, -1]

seed = 42
np.random.seed(seed)
X_train, X_test, y_train, y_test = train_test_split(X, y, test_size=0.20, random_state=seed)

ebm = ExplainableBoostingClassifier()
ebm.fit(X_train, y_train)

auc = roc_auc_score(y_test, ebm.predict_proba(X_test)[:, 1])
print("AUC: {:.3f}".format(auc))
AUC: 0.931
show(ebm.explain_global())
show(ebm.explain_local(X_test[:5], y_test[:5]), 0)
Further Resources
Bibliography
[1] Yin Lou, Rich Caruana, Johannes Gehrke, and Giles Hooker. Accurate intelligible models with pairwise interactions. In Proceedings of the 19th ACM SIGKDD international conference on Knowledge discovery and data mining, 623–631. 2013. Paper Link
[2] Trevor Hastie and Robert Tibshirani. Generalized additive models: some applications. Journal of the American Statistical Association, 82(398):371–386, 1987.
[3] Yin Lou, Rich Caruana, and Johannes Gehrke. Intelligible models for classification and regression. In Proceedings of the 18th ACM SIGKDD international conference on Knowledge discovery and data mining, 150–158. 2012. Paper Link
[4] Rich Caruana, Yin Lou, Johannes Gehrke, Paul Koch, Marc Sturm, and Noemie Elhadad. Intelligible models for healthcare: predicting pneumonia risk and hospital 30-day readmission. In Proceedings of the 21th ACM SIGKDD international conference on knowledge discovery and data mining, 1721–1730. 2015. Paper Link