Group Importances#
In this notebook we show how to compute and interpret Overall Importances shown in InterpretML’s Global Explanations for EBMs. We also show how to compute importances of a group of features or terms.
Throughout the notebook we use term to denote both single features and interactions (pairs).
This notebook can be found in our examples folder on GitHub.
# install interpret if not already installed
try:
import interpret
except ModuleNotFoundError:
!pip install --quiet interpret pandas scikit-learn
Train an Explainable Boosting Machine (EBM) for a regression task
Let’s use the Boston dataset as a reference and train an EBM.
import numpy as np
import pandas as pd
from sklearn.datasets import load_diabetes
from interpret.glassbox import ExplainableBoostingRegressor
X, y = load_diabetes(return_X_y=True, as_frame=True)
ebm = ExplainableBoostingRegressor()
ebm.fit(X, y)
ExplainableBoostingRegressor()In a Jupyter environment, please rerun this cell to show the HTML representation or trust the notebook.
On GitHub, the HTML representation is unable to render, please try loading this page with nbviewer.org.
Parameters
| feature_names | None | |
| feature_types | None | |
| max_bins | 1024 | |
| max_interaction_bins | 64 | |
| interactions | '5x' | |
| exclude | None | |
| validation_size | 0.15 | |
| outer_bags | 14 | |
| inner_bags | 0 | |
| learning_rate | 0.04 | |
| greedy_ratio | 10.0 | |
| cyclic_progress | False | |
| smoothing_rounds | 500 | |
| interaction_smoothing_rounds | 100 | |
| max_rounds | 50000 | |
| early_stopping_rounds | 100 | |
| early_stopping_tolerance | 1e-05 | |
| callback | None | |
| min_samples_leaf | 4 | |
| min_hessian | 0.0 | |
| reg_alpha | 0.0 | |
| reg_lambda | 0.0 | |
| max_delta_step | 0.0 | |
| gain_scale | 5.0 | |
| min_cat_samples | 10 | |
| cat_smooth | 10.0 | |
| missing | 'separate' | |
| max_leaves | 2 | |
| monotone_constraints | None | |
| objective | 'rmse' | |
| n_jobs | -2 | |
| random_state | 42 |
Explain the Model
EBMs provide two different kinds of explanations: global explanations about the overall model behavior and local explanations about individual predictions from the model.
Global Explanation
Global Explanations are useful for understanding what a model finds important, as well as identifying potential flaws in its decision making or the training data. Let’s start by computing and displaying a global explanation:
from interpret import show
show(ebm.explain_global(name='EBM'))
The overall importance for each term is calculated as the average absolute contribution (score) a term (feature or pair) makes when predicting across the training dataset. This way of measuring term importance tends to favor terms which, on average, have large impact on predictions for many cases. The overall importance is not a measure of positive/negative – it is a measure of how important each term is in the scores. For regression, these scores are represented in the same units as the y-axis of the feature graphs. For classification, the scores would be in logits.
Going beyond overall term importances, because EBMs are additive models we can measure exactly how each term contributes to a prediction. Let’s take a look at the graph of the term, bp, by selecting it in the drop-down menu.
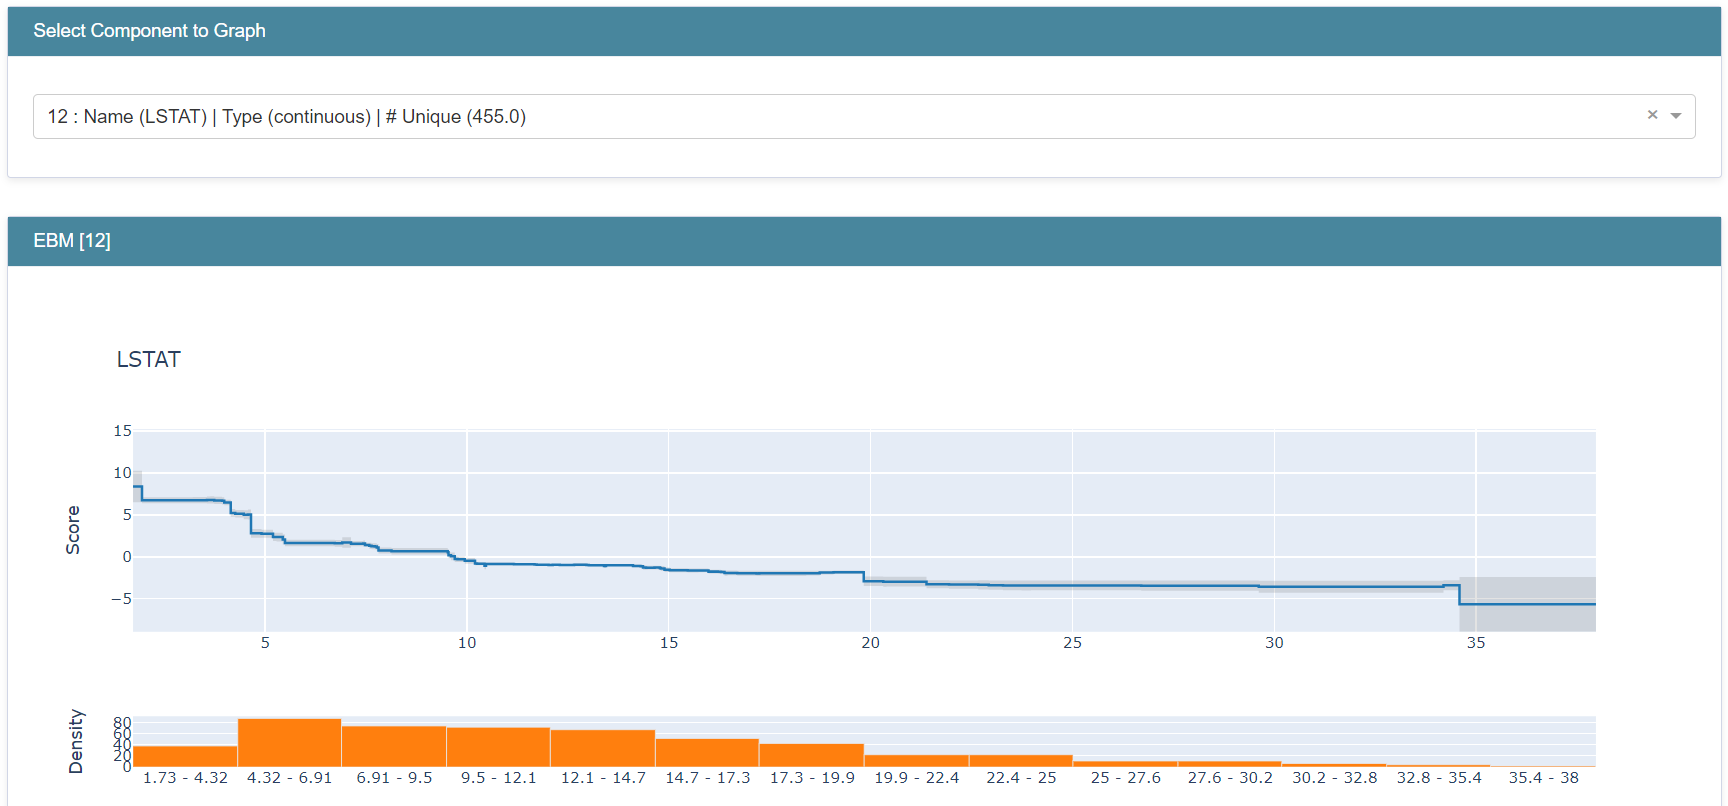
The way to interpret this is that if a new datapoint came in with bp = 0.1, the model adds about +33.1 to the final prediction. However, for a different datapoint with bp = 0.13, the model would now add approx. +36.7 to the prediction.
To make individual predictions, the model uses each term graph as a look up table, notes the contribution per term, and sums them together with the learned intercept to make a prediction. In regression, the intercept is the mean target (label) of the training set, and each term adds or subtracts to this mean. In classification, the intercept reflects the base rate of the positive class on a log scale. The gray above and below the graph shows the confidence of the model in that region of the graph.
Local Explanations
We can see the full breakdown of a prediction on a single sample with Local Explanations. Here’s how to compute the prediction breakdown for the first sample in our dataset:
from interpret import show
show(ebm.explain_local(X[:1], y[:1]), 0)
Let’s take a look at the prediction by selecting it in the drop-down menu.
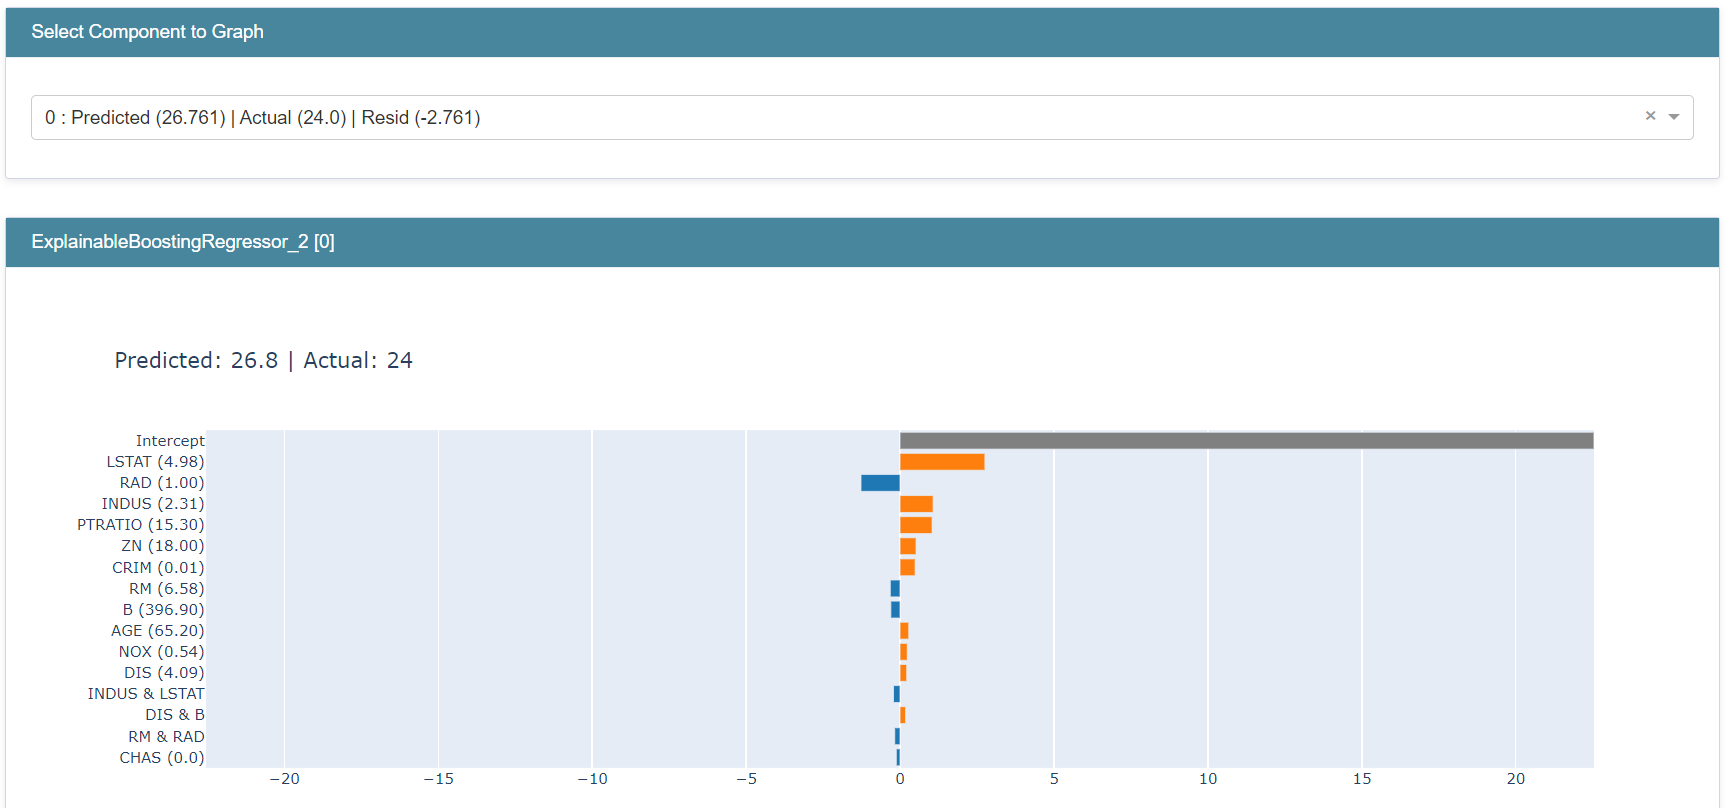
The model prediction is 188.50. We can see that the intercept adds about +151.9, bp subtracts about 0.02, and age adds about 0.04. If we repeat this process for all the terms, we’ll arrive exactly at the model prediction of 188.50.
Viewing _all_ term importances
Due to space limitations in our graphs, the term importance summary only shows the top 15 terms. To view the overall importances of all terms of a trained EBM - the scores shown in the global explanation summary - we use term_importances():
importances = ebm.term_importances()
names = ebm.term_names_
for (term_name, importance) in zip(names, importances):
print(f"Term {term_name} importance: {importance}")
Term age importance: 3.2357671259109337
Term sex importance: 10.431907227185329
Term bmi importance: 17.34189713649959
Term bp importance: 11.393360813850238
Term s1 importance: 1.535831437239701
Term s2 importance: 3.172597989399135
Term s3 importance: 7.2821022176597054
Term s4 importance: 6.054837490610567
Term s5 importance: 17.198646537608173
Term s6 importance: 5.152081623321795
Term age & sex importance: 0.4725809787227808
Term age & bmi importance: 0.10135572000288157
Term age & bp importance: 0.09552576532746926
Term age & s1 importance: 0.09585794633580108
Term age & s2 importance: 0.10107722143347368
Term age & s3 importance: 0.07597187828537556
Term age & s4 importance: 0.11988913771227068
Term age & s5 importance: 0.2066790144907166
Term age & s6 importance: 0.10062143187028369
Term sex & bmi importance: 0.2859552583866692
Term sex & bp importance: 0.27837954146337107
Term sex & s1 importance: 0.14732894822902626
Term sex & s2 importance: 0.1103065104688989
Term sex & s3 importance: 0.13808981390425223
Term sex & s4 importance: 0.10426360478225687
Term sex & s5 importance: 0.18501086415333762
Term sex & s6 importance: 0.23049385484114696
Term bmi & bp importance: 0.17209899481456328
Term bmi & s1 importance: 0.0845790868419545
Term bmi & s2 importance: 0.10887850500801943
Term bmi & s3 importance: 0.0911813706367947
Term bmi & s4 importance: 0.13291750715620276
Term bmi & s5 importance: 0.1873583462525993
Term bmi & s6 importance: 0.10569085759007799
Term bp & s1 importance: 0.078631758429585
Term bp & s2 importance: 0.07373211067105326
Term bp & s3 importance: 0.07064385310103567
Term bp & s4 importance: 0.06167031232815315
Term bp & s5 importance: 0.1483047200755205
Term bp & s6 importance: 0.11216599709914293
Term s1 & s2 importance: 0.05965865431226812
Term s1 & s3 importance: 0.08064774069673451
Term s1 & s4 importance: 0.06840054307477278
Term s1 & s5 importance: 0.13935095844463347
Term s1 & s6 importance: 0.09490826623549486
Term s2 & s3 importance: 0.09831440894948183
Term s2 & s4 importance: 0.08097684589081885
Term s2 & s5 importance: 0.15511104368399387
Term s2 & s6 importance: 0.08440763376208124
Term s3 & s4 importance: 0.04706257075733446
Term s3 & s5 importance: 0.16139529192563792
Term s3 & s6 importance: 0.08252884644678686
Term s4 & s5 importance: 0.1541665164710779
Term s4 & s6 importance: 0.14751894821989003
Term s5 & s6 importance: 0.13806486496784195
Note that mean absolute contribution isn’t the only way of calculating term importances. Another metric our package provides is the min_max option, which computes the difference between the max (the highest score on the graph) and min (the lowest score on the graph) values for each term. Term importance measured with min_max is a measure of the maximum impact a term can have, even though it might have this amount of impact on very few cases, whereas avg_weight(the default parameter) is a measure of typical (average) contribution of a term across all cases.
importances = ebm.term_importances("min_max")
names = ebm.term_names_
for (term, importance) in zip(names, importances):
print(f"Term {term} importance: {importance}")
Term age importance: 16.3031783304845
Term sex importance: 20.947878749427844
Term bmi importance: 99.88236502169572
Term bp importance: 70.5812655361787
Term s1 importance: 13.631773120507084
Term s2 importance: 19.631457279237022
Term s3 importance: 53.12806663213374
Term s4 importance: 28.821515052870232
Term s5 importance: 63.81503875799717
Term s6 importance: 36.767153432203166
Term age & sex importance: 3.7974965702161376
Term age & bmi importance: 1.1894966483916958
Term age & bp importance: 1.1736308901289247
Term age & s1 importance: 1.2354656548301646
Term age & s2 importance: 2.8253261702495527
Term age & s3 importance: 1.343812154435361
Term age & s4 importance: 2.013098602451813
Term age & s5 importance: 1.5502464253471628
Term age & s6 importance: 1.0739039943451383
Term sex & bmi importance: 1.7438025329673574
Term sex & bp importance: 1.4270390040335539
Term sex & s1 importance: 0.6162735196445528
Term sex & s2 importance: 0.7801820659331898
Term sex & s3 importance: 2.279956858035636
Term sex & s4 importance: 0.9418435046573672
Term sex & s5 importance: 1.2580289560025046
Term sex & s6 importance: 1.9268684755900183
Term bmi & bp importance: 2.295502713149409
Term bmi & s1 importance: 1.3233977281367606
Term bmi & s2 importance: 0.8070436905760755
Term bmi & s3 importance: 1.5267057040823595
Term bmi & s4 importance: 1.000541174431587
Term bmi & s5 importance: 1.851201057290557
Term bmi & s6 importance: 1.1331729602467284
Term bp & s1 importance: 1.3125327418793418
Term bp & s2 importance: 1.5777765748338832
Term bp & s3 importance: 1.1504190201032518
Term bp & s4 importance: 1.2275568855160026
Term bp & s5 importance: 1.3551373947948684
Term bp & s6 importance: 2.403941642798088
Term s1 & s2 importance: 1.1497235477699417
Term s1 & s3 importance: 0.8306824131966906
Term s1 & s4 importance: 1.779658900716116
Term s1 & s5 importance: 2.0701342454778384
Term s1 & s6 importance: 0.8510969433460884
Term s2 & s3 importance: 0.9323554363987379
Term s2 & s4 importance: 0.9986297627391435
Term s2 & s5 importance: 1.5736306206593715
Term s2 & s6 importance: 1.1238466713887272
Term s3 & s4 importance: 1.0991085331938735
Term s3 & s5 importance: 2.384711182106946
Term s3 & s6 importance: 0.8405086368940717
Term s4 & s5 importance: 2.816076553141703
Term s4 & s6 importance: 0.9920670661576829
Term s5 & s6 importance: 3.3784078971152836
Feature/Term Group Importances
We provide utility functions to compute the importances of groups of features or terms and, optionally, append these importances to the global feature attribution bar graph. Note that shape function graphs are not generated for groups of features/terms, just their overall importance is shown on the Summary.
Grouping terms and then calculating and displaying their importance does not change the model and the predictions it makes in any way – group importances are just a method for computing the importance of groups of terms in addition to the importances of individual terms that are already calculated. As you’ll see in the examples below, it’s OK for features/terms to overlap in different groups.
Computing group importances
Let’s use the Adult dataset and train an EBM for a classification task.
import numpy as np
import pandas as pd
from interpret.glassbox import ExplainableBoostingClassifier
df = pd.read_csv(
"https://archive.ics.uci.edu/ml/machine-learning-databases/adult/adult.data",
header=None)
df.columns = [
"Age", "WorkClass", "fnlwgt", "Education", "EducationNum",
"MaritalStatus", "Occupation", "Relationship", "Race", "Gender",
"CapitalGain", "CapitalLoss", "HoursPerWeek", "NativeCountry", "Income"
]
X = df.iloc[:, :-1]
y = df.iloc[:, -1]
adult_ebm = ExplainableBoostingClassifier()
adult_ebm.fit(X, y)
ExplainableBoostingClassifier()In a Jupyter environment, please rerun this cell to show the HTML representation or trust the notebook.
On GitHub, the HTML representation is unable to render, please try loading this page with nbviewer.org.
Parameters
| feature_names | None | |
| feature_types | None | |
| max_bins | 1024 | |
| max_interaction_bins | 64 | |
| interactions | '3x' | |
| exclude | None | |
| validation_size | 0.15 | |
| outer_bags | 14 | |
| inner_bags | 0 | |
| learning_rate | 0.015 | |
| greedy_ratio | 10.0 | |
| cyclic_progress | False | |
| smoothing_rounds | 75 | |
| interaction_smoothing_rounds | 75 | |
| max_rounds | 50000 | |
| early_stopping_rounds | 100 | |
| early_stopping_tolerance | 1e-05 | |
| callback | None | |
| min_samples_leaf | 4 | |
| min_hessian | 0.0001 | |
| reg_alpha | 0.0 | |
| reg_lambda | 0.0 | |
| max_delta_step | 0.0 | |
| gain_scale | 5.0 | |
| min_cat_samples | 10 | |
| cat_smooth | 10.0 | |
| missing | 'separate' | |
| max_leaves | 2 | |
| monotone_constraints | None | |
| objective | 'log_loss' | |
| n_jobs | -2 | |
| random_state | 42 |
We then create a list of terms – single features or interactions – as our group and compute its importance:
from interpret.glassbox._ebm._research import *
social_feature_group = ["MaritalStatus", "Relationship", "Race", "Gender", "NativeCountry"]
importance = compute_group_importance(social_feature_group, adult_ebm, X)
print(f"Group: {social_feature_group} - Importance: {importance}")
Group: ['MaritalStatus', 'Relationship', 'Race', 'Gender', 'NativeCountry'] - Importance: 1.34025432582611
In this example we create a group with five terms and compute its importance. Similar to single feature importances, we interpret this score as the average absolute contribution this group of terms makes when predicting across the training dataset. Note that for each prediction, the contribution of each term in the group will be added before taking the absolute value.
We also have the option to create a global explanation containing the group importance or append it to an existing explanation:
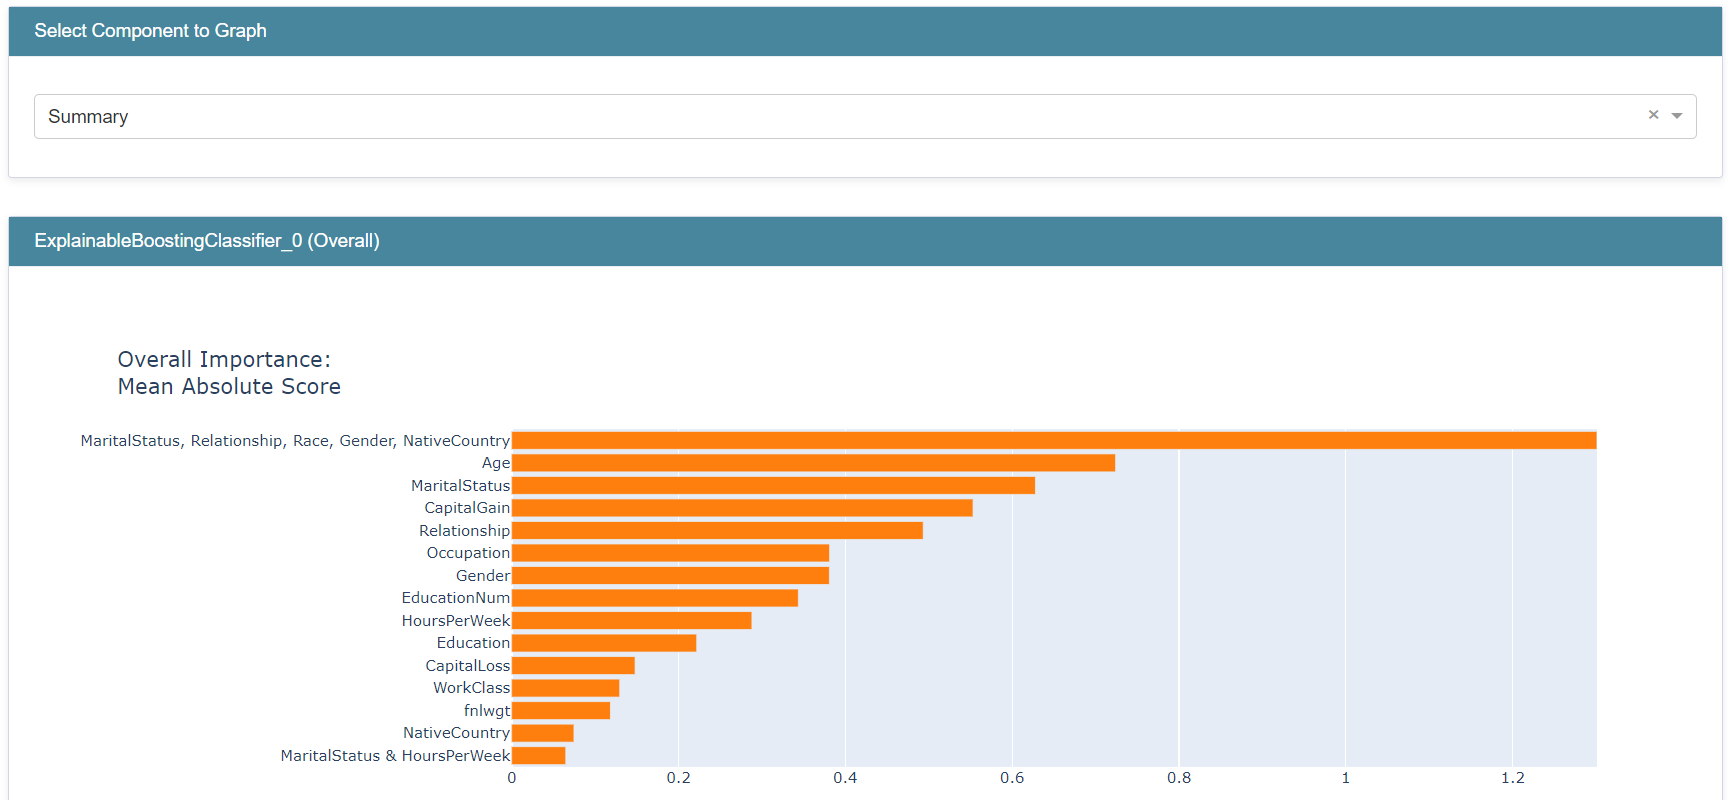
my_global_exp = append_group_importance(social_feature_group, adult_ebm, X)
show(my_global_exp)
The importance of social_feature_group is about 1.30, which is higher than the importance of any individual feature/term:
We could make this type of comparison between different groups too:
education_feature_group = ["Education", "EducationNum"]
relationship_feature_group = ["MaritalStatus", "Relationship"]
social_feature_group = ["MaritalStatus", "Relationship", "Race", "Gender", "NativeCountry"]
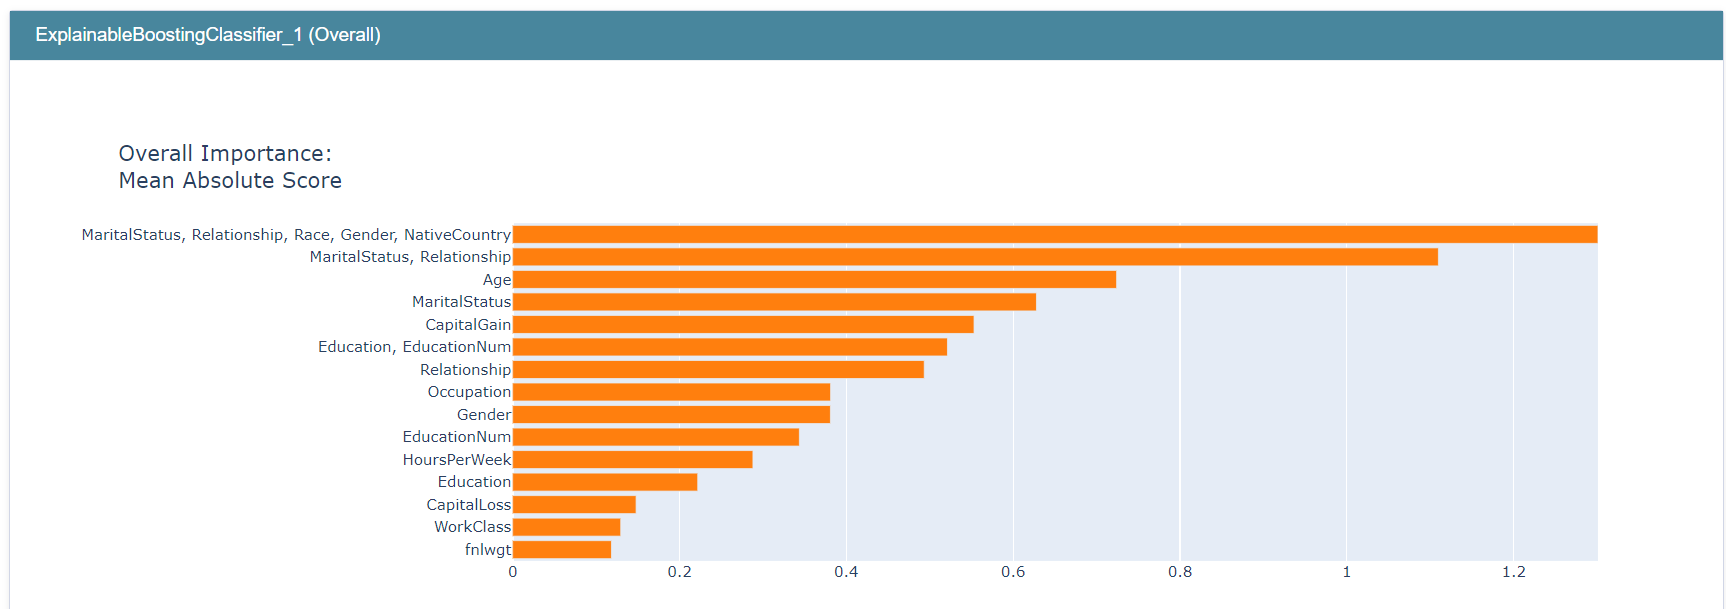
my_global_exp = append_group_importance(social_feature_group, adult_ebm, X)
my_global_exp = append_group_importance(education_feature_group, adult_ebm, X, global_exp=my_global_exp)
my_global_exp = append_group_importance(relationship_feature_group, adult_ebm, X, global_exp=my_global_exp)
show(my_global_exp)
The importance of education_feature_group is about 0.52, higher than each of its individual terms but smaller than some individual terms such as Age. Remember, creating groups of features/terms does not, in any way, change the model and its predictions, it only allows you to estimate the importance of these groups.
This graph, for example, suggests that features related to relationships are more important than features reated to education.
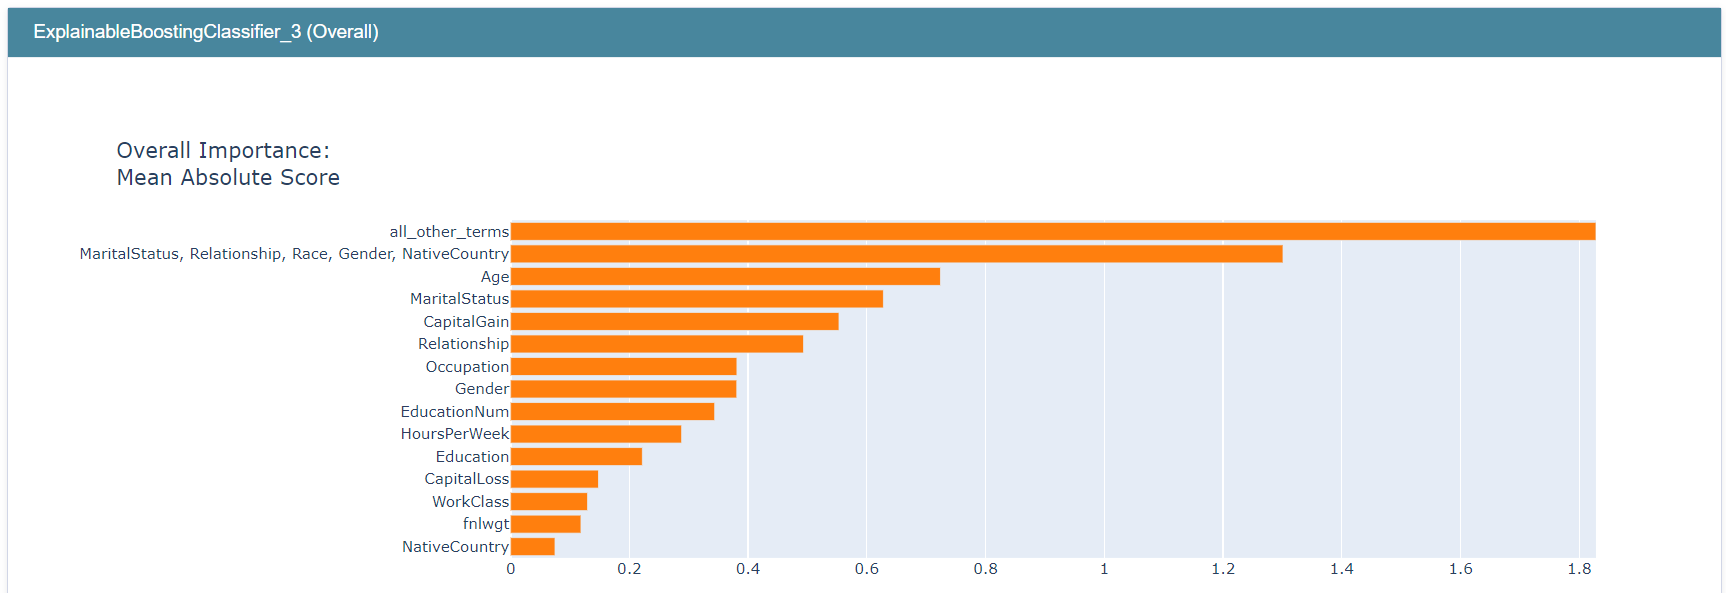
We can also compare a group we are interested in (e.g. social_feature_group) with a group of all other reamining terms.
social_feature_group = ["MaritalStatus", "Relationship", "Race", "Gender", "NativeCountry"]
all_other_terms = [term for term in adult_ebm.term_names_ if term not in social_feature_group]
my_global_exp = append_group_importance(social_feature_group, adult_ebm, X)
my_global_exp = append_group_importance(all_other_terms, adult_ebm, X, group_name="all_other_terms", global_exp=my_global_exp)
show(my_global_exp)
Note that all_other_terms has the highest importance score, followed by social_feature_group.
It’s even possible to create a group with all terms.
all_terms_group = [term for term in adult_ebm.term_names_]
mew_global_exp = append_group_importance(all_terms_group, adult_ebm, X, group_name="all_terms")
show(mew_global_exp)
Finally, we also expose a function to compute the importances of a group of terms as well as all the model’s original terms.
my_dict = get_group_and_individual_importances([social_feature_group, education_feature_group], adult_ebm, X)
for key in my_dict:
print(f"Term: {key} - Importance: {my_dict[key]}")
Term: MaritalStatus, Relationship, Race, Gender, NativeCountry - Importance: 1.34025432582611
Term: MaritalStatus - Importance: 0.9601033154733993
Term: Age - Importance: 0.9075504363031829
Term: CapitalGain - Importance: 0.7242090336171584
Term: Education, EducationNum - Importance: 0.513598199392493
Term: Occupation - Importance: 0.4206553098809097
Term: Gender - Importance: 0.39234898577594574
Term: Education - Importance: 0.3657090790264731
Term: HoursPerWeek - Importance: 0.295931834424345
Term: Relationship - Importance: 0.26977012817931756
Term: CapitalLoss - Importance: 0.17264993670426207
Term: EducationNum - Importance: 0.16219654512179993
Term: fnlwgt - Importance: 0.12630437546911444
Term: WorkClass - Importance: 0.11054790459401065
Term: NativeCountry - Importance: 0.10590814015759696
Term: Age & HoursPerWeek - Importance: 0.08747000726219625
Term: MaritalStatus & HoursPerWeek - Importance: 0.07908211003457837
Term: Race - Importance: 0.06401839354691273
Term: Age & Education - Importance: 0.056293511764680844
Term: Age & fnlwgt - Importance: 0.03956941421445449
Term: EducationNum & MaritalStatus - Importance: 0.03188515266013881
Term: Age & Occupation - Importance: 0.030102449272507294
Term: MaritalStatus & Occupation - Importance: 0.02770991006053034
Term: Occupation & HoursPerWeek - Importance: 0.025685107241037366
Term: Age & EducationNum - Importance: 0.02561869599593182
Term: Age & WorkClass - Importance: 0.024653672215865997
Term: fnlwgt & Education - Importance: 0.02461996199318464
Term: Relationship & CapitalGain - Importance: 0.02331988715397711
Term: fnlwgt & HoursPerWeek - Importance: 0.02155765061046503
Term: Relationship & HoursPerWeek - Importance: 0.020903186234530153
Term: Age & Race - Importance: 0.020278597870680568
Term: Age & Gender - Importance: 0.016984446788631542
Term: fnlwgt & Occupation - Importance: 0.015503133192922715
Term: fnlwgt & EducationNum - Importance: 0.015060035632979488
Term: Age & Relationship - Importance: 0.014732858924027977
Term: Gender & HoursPerWeek - Importance: 0.014203688026910861
Term: WorkClass & Relationship - Importance: 0.013718056612302128
Term: EducationNum & HoursPerWeek - Importance: 0.013324985610287074
Term: EducationNum & CapitalGain - Importance: 0.01306766661380556
Term: WorkClass & EducationNum - Importance: 0.013027492650523873
Term: Age & CapitalLoss - Importance: 0.011491308022406865
Term: Education & HoursPerWeek - Importance: 0.011470522980128248
Term: EducationNum & Occupation - Importance: 0.01016883217568739
Term: WorkClass & Occupation - Importance: 0.0097158801146326
Term: Education & MaritalStatus - Importance: 0.0092937726564939
Term: WorkClass & Education - Importance: 0.008705586677867333
Term: MaritalStatus & Gender - Importance: 0.008532307065673103
Term: EducationNum & NativeCountry - Importance: 0.007629606584623361
Term: WorkClass & Race - Importance: 0.007091433657056002
Term: Education & Occupation - Importance: 0.007024419235217543
Term: Age & NativeCountry - Importance: 0.006666396663125481
Term: fnlwgt & NativeCountry - Importance: 0.006341268559588317
Term: MaritalStatus & CapitalGain - Importance: 0.006237633389185402
Term: Occupation & Relationship - Importance: 0.005456116654319111
Term: EducationNum & Relationship - Importance: 0.0053609779262503085
Term: WorkClass & CapitalLoss - Importance: 0.004844316287242584
Term: EducationNum & CapitalLoss - Importance: 0.004785915667903553
Term: Occupation & NativeCountry - Importance: 0.004065012680322359